
Cap rates are loaded ratios. Despite being one of the most commonly used metrics to evaluate and compare real estate investment opportunities, cap rates have their flaws and limitations. You have to unpack them to understand the value they are trying to represent. To gain a deeper understanding of cap rates, we’ll start by describing what they are and then move into comparisons.
What’s In A Cap Rate?
In the simplest terms, a cap rate is the property’s initial unleveraged yield, calculated as the annual net income a property produces compared against the property’s value. The cap rate formula is:
NOI / Price
Where NOI is net operating income and price is the property’s purchase price. A property that receives $10,000 in NOI annually with a purchase price of $100,000 has a yield or cap rate of 10%.
If you’ve done some research on cap rates, you’ve probably read that a high cap rate means higher cash flows but more risk and that a lower cap rate means lower cash flows with less risk. While that is true a lot of the time, it is not the case all of the time. Thus, reliance on cap rates alone could leave an investor with a property having a very different risk profile than they were hoping for.
Same Cap Rate, But Different Expectations
Let’s say you are comparing two properties:
A) $100,000 NOI with a purchase price of $2,000,000 and a cap rate of 5%.
B) $100,000 NOI with a purchase price of $2,000,000 and a cap rate of 5%.
Property A and Property B have the same cap rate. At first blush, the uninitiated investor may think both properties have the same risk profile. But you need to dig a little deeper. Here, the cap rates are only serving to indicate the initial annual yield on the two properties. However, additional info is needed to evaluate the certainty of income and potential appreciation. Additional info consists of the structure of and remaining term on any leases, strength of the tenants, the physical condition of the property, and of course, location, to name just a few. Risks come into play when you factor in occupancy levels and potential repairs.
Let’s assume that Property A is expected to provide consistent income because of long-term leases, while Property B, on the other hand, has more inconsistent income due to high potential tenant turnover, but conversely may have more opportunity to increase revenue by backfilling its vacating tenants at higher rates. After an initial review, it appears to be an easy choice between the two - Property A has the same cap rate but less risk in projected cash flow. But how do we account for the potential revenue increases of Property B?
Internal Rate of Return (IRR)
We’ve determined that cap rates may not give us an apples-to-apples comparison of investment options in this example. Is there another metric we can add to help paint a more complete picture? Yes — IRR or internal rate of return is commonly used to value stocks and bonds, but it can also be used with real estate.
IRR represents an annualized growth rate of a given investment. Ok, that sounds like the cap rate, which is an annualized yield. But IRR is so much more. For starters, although IRR represents an annualized return, that figure represents the average compounding growth rate over the investment’s entire expected holding period. Cap rates, by contrast, represent yield at a static point in time without consideration of growth.
Running the Numbers
Now, let’s look at potential cash flow over the projected holding period for both properties. Again, we’re assuming both properties will be purchased for $2,000,000 and at a 5.0% cap rate, which equates to $100,000 of projected year 1 NOI - so far no difference. Now, enter growth assumptions. Remember, in our example, Property A features a long-term lease - here, we’ll assume no growth in the rental rate, but high certainty of income. For Property B, by contrast, we’ll assume a projected annual rental rate increase of approximately 6%.
To calculate IRR, we also need the terminal cash flow, which is the sale price of the property. For the sake of keeping things consistent, we’ll apply a 5.0% cap rate to year 5 NOI on both properties in order to determine the projected sale price. Notice that our final year (year 5) includes both annual cash flow and anticipated sale proceeds. Here’s the breakdown:
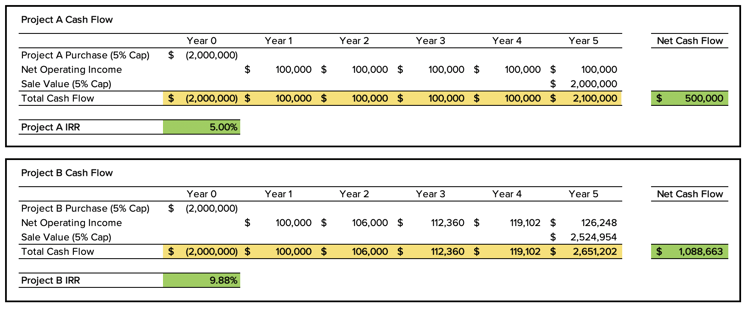
Hypothetical results are for illustrative purposes only and are not intended to represent the past or future performance of any specific investment.
Interpreting the Results
In our example, although both properties are projecting the same cap rate, both at purchase and at the exit, Property A has an anticipated IRR of 5.0%, while Property B has a projected IRR of 10.0%. Clearly, Property B has higher total return expectations than Property A. However, it is important to recognize that the cash flow assumptions, especially with Property B, are just that - assumptions. The assumed cash flows of Property B with its frequent lease expirations may be far more speculative than Property A with a long-term contractual lease. Thus, like most investments, with greater expected return comes greater risk.
Cap rates can be a very useful metric for valuing real estate when applied appropriately. But like most metrics, it provides only one piece of the valuation puzzle. In our simple example, you can see why cap rates may not be the appropriate metrics, or at least not the sole metric that should be evaluated. IRR is another great metric to add to your set of valuation tools, but also has its shortcomings, which we will address in more detail in future blog articles. In short, there is not a “magic bullet” for property valuation. Accurate property valuation is an intense research-driven process that considers a variety of qualitative and quantitative factors. But those who decide to go down its road can be rewarded with more insight into a property’s strengths and risks, resulting in more informed investment decisions.
This material is for general information and educational purposes only. Information is based on data gathered from what we believe are reliable sources. It is not guaranteed as to accuracy, does not purport to be complete and is not intended to be used as a primary basis for investment decisions. It should also not be construed as advice meeting the particular investment needs of any investor.
Realized does not provide tax or legal advice. This material is not a substitute for seeking the advice of a qualified professional for your individual situation.